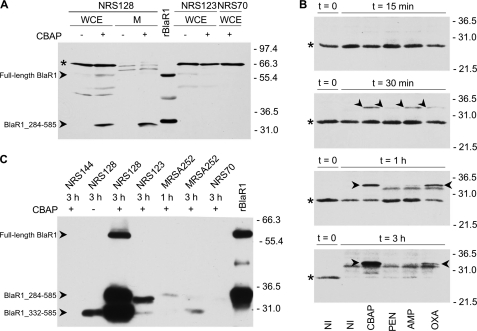
FIGURE 3.
Time dependence of accumulation of BlaR1 species in S. aureus strain NRS128 after activation of the bla system by β-lactams. A, BlaR1 detection in whole-cell extracts (WCE) and in membrane fractions (M) of NRS128, NRS123, and NRS70 cells, compared with rBlaR1. The S. aureus samples correspond to non-induced cultures (−) or cultures induced for 3 h with CBAP (+). The proteins were separated by SDS-PAGE (12% gel) and transferred to nitrocellulose membrane, and BlaR1 was detected by Western blot using anti-BlaRS antibodies and the ONE-HOUR IP-WesternTM kit (GenScript). The arrowheads indicate bands corresponding to the BlaR1 species, labeled accordingly. The faint band seen in S. aureus whole-cell extracts could correspond to full-length BlaR1 but could also be a nonspecific signal. Recombinant BlaR1 has an additional C-terminal tag, which includes the His6 tag. The asterisk indicates nonspecific bands (also see supplemental Fig. S5). B, BlaR1 levels in whole-cell extracts (80-μg portion of the total protein) of non-induced S. aureus NRS128 cultures (NI) and in S. aureus NRS128 cultures induced for different times (15 min, 30 min, 1 h, and 3 h) with the indicated antibiotic (the results for the three other strains are given in the supplemental material). The proteins were separated by SDS-PAGE (12% gels) and transferred to nitrocellulose membrane, and BlaR1 was detected by Western blot using anti-BlaRS antibodies and blocking with human IgG, Protein A/G blocker (GenScript). The arrowheads indicate bands corresponding to the 33–35-kDa membrane-anchored C-terminal BlaR1 fragment (BlaR1_284–585). The asterisks indicate nonspecific bands. C, BlaR1 immunoprecipitated from non-induced and β-lactam-induced S. aureus and from E. coli. BlaR1 was immunoaffinity purified with anti-BlaRS/Protein A resin from whole-cell extracts of NRS128, NRS123, NRS70, and MRSA252 non-induced (−) and 1- and/or 3-h CBAP-induced bacteria (+). Immunoprecipitated rBlaR1 from E. coli is also shown. The eluted proteins were separated by SDS-PAGE (11% gel) and transferred to PVDF membrane, and BlaR1 was visualized by Western blot using anti-BlaRS antibodies and the ONE-HOUR IP-WesternTM kit (GenScript). Numbers on the right indicate the position of migration of the molecular mass markers (kDa).

