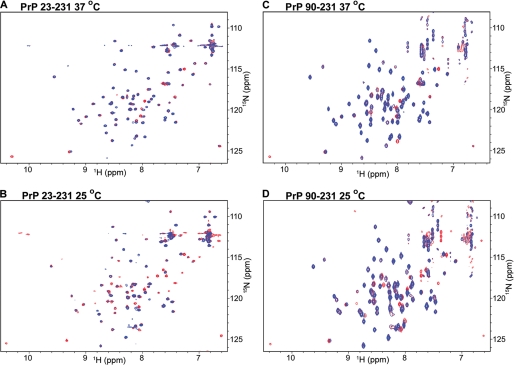
FIGURE 3.
Two-dimensional 15N-1H HSQC spectra of PrP(23–231) and PrP(90–231). A and B, two-dimensional 15N-1H HSQC spectra of PrP(23–231) (red cross-peaks) were overlaid with those of Cu2+-bound PrP(23–231) (blue cross-peaks) at 37 °C (A) and 25 °C (B). C and D, two-dimensional 15N-1H HSQC spectra of PrP(90–231) (red cross-peaks) and Cu2+-bound PrP(90–231) (blue cross-peaks) were at 37 °C (C) and 25 °C (D).

