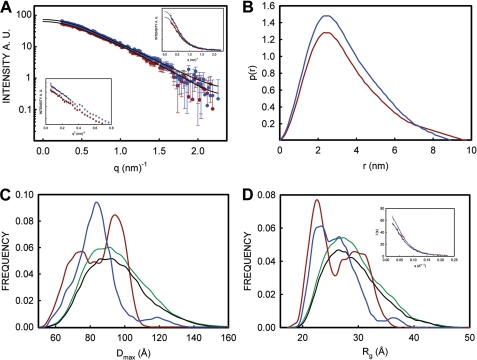
FIGURE 7.
SAXS measurements of PrP and Cu2+-bound PrP. A, scattering profiles of PrP (red circles) and Cu2+-bound PrP (blue circles) plotted against q (q = 4πsinθ/λ). Black traces are fitted lines obtained from P(r) distribution function. Differences in the scatter profiles of PrP and Cu2+-bound PrP are better seen in the linear plot (top right inset). Left bottom panel shows Guinier plots (ln(I(q)) versus q2) of PrP (red circle) and Cu2+-bound PrP (blue triangle). Straight lines show regions of the curve from where Rg values were calculated using Guinier plot. B, distance distribution function (P(r) function) of PrP (red trace) and Cu2+-bound PrP (blue trace). C, Dmax; D, Rg distribution function calculated from the scattering profiles of PrP(23–231) (red trace in A) and Cu2+-bound PrP (blue trace in a) using the EOM method. In each (C and D), black traces show Dmax (C) and Rg (D) distributions calculated from the pool of 10,000 conformations from PrP scattering profiles and green traces are from those of Cu2+-bound profiles. Red trace in each panel shows distribution from the selected 20 structures from PrP scattering profiles, and blue trace shows that of Cu2+-bound PrP. D, inset, EOM fitting of the PrP (black over blue trace) and Cu2+-bound PrP (black over red trace) with χ values of 0.778 and 0.775, respectively.

