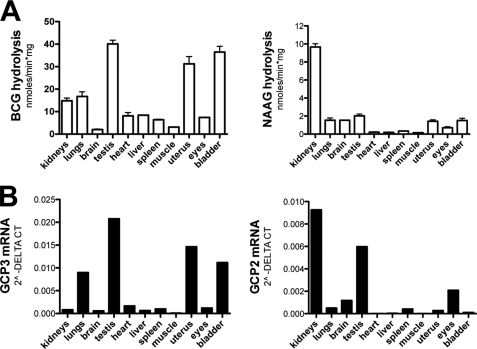
FIGURE 3.
A, tissue distribution of BCG hydrolase and NAAG hydrolase activities in mouse. BCG hydrolase and NAAG hydrolase activities were measured in the presence of 120 mm NaCl, 2.5 mm CaCl2, 1 mm MgCl2, and 5 μm substrate. Error bars, S.D. of two independent experiments. B, RT-QPCR distribution of GCP2 and GCP3 (mean of duplicates from three different animals).

