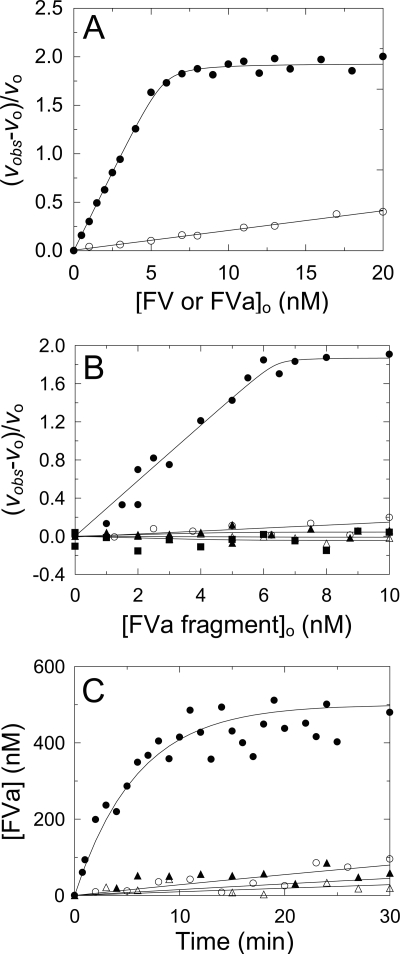
FIGURE 1.
Effect of FV, FVa, and FV activation products, and exosite I and II ligands on FV activation measured with NotD. A, fractional change in initial velocity, (vobs − vo)/vo, of 200 μm CH3SO2-LGR-pNA hydrolysis by 4.8 nm NotD as a function of total concentration of FVa (●) or FV (○) ([FVa or FV]o). The solid line in A represents the least squares fit by the quadratic equation with the parameters given under “Results.” B, initial rates (vobs) of 200 μm CH3SO2-LGR-pNA hydrolysis by 5 nm NotD as a function of the total concentration of FV activation products ([FVa fragment]o), Va-h·Va-l (●), Va-l (○), Va-h (▴), B1019–1545 (△), and B710–1018 (■). C, progress curves of 500 nm FV activation by 0.2 nm thrombin ([FVa]) determined from a stoichiometric titration of the fractional change in rate as in A, in the absence (●) or presence (○) of 100 nm exosite II aptamer, 10 μm Hir54–65(SO3−) (▴), or 1 μm exosite I aptamer (△). The solid line for the reaction in the absence of inhibitors represents the nonlinear least squares fit to the data by a single exponential and the solid lines for the inhibitors represent the linear least squares fits to the data. Activity measurements were performed and analyzed as described under “Experimental Procedures.”

