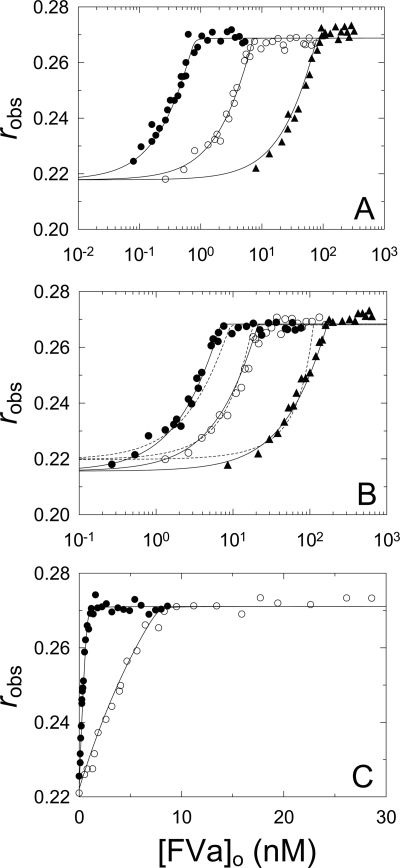
FIGURE 2.
[5F]FFR-NotD binding to FVa in the absence and presence of phospholipid vesicles. A, measured anisotropy (robs) as a function of total FVa concentration ([FVa]o) at 1 (●), 9 (○), and 100 nm (▴) [5F]FFR-NotD. Solid lines represent the simultaneous fit by the quadratic equation with the parameters given in Table 1. B, [5F]FFR-NotD (9 nm) in the absence (●) or presence of 9 (○) or 102 nm (▴) native NotD as a function of total FVa concentration ([FVa]o). The stoichiometric factors (n and m) were fit (solid lines) or fixed at 1 (dotted lines). Solid lines represent the simultaneous fit by the cubic binding equation with the parameters given in Table 1. C, titrations as in A in the presence of 50 μm PC/PS SUVs at 1 (●) and 9 nm (○) [5F]FFR-NotD. Solid lines represent the simultaneous fit by the quadratic binding equation with the parameters given in Table 1. Anisotropy titrations were performed and analyzed as described under “Experimental Procedures.”

