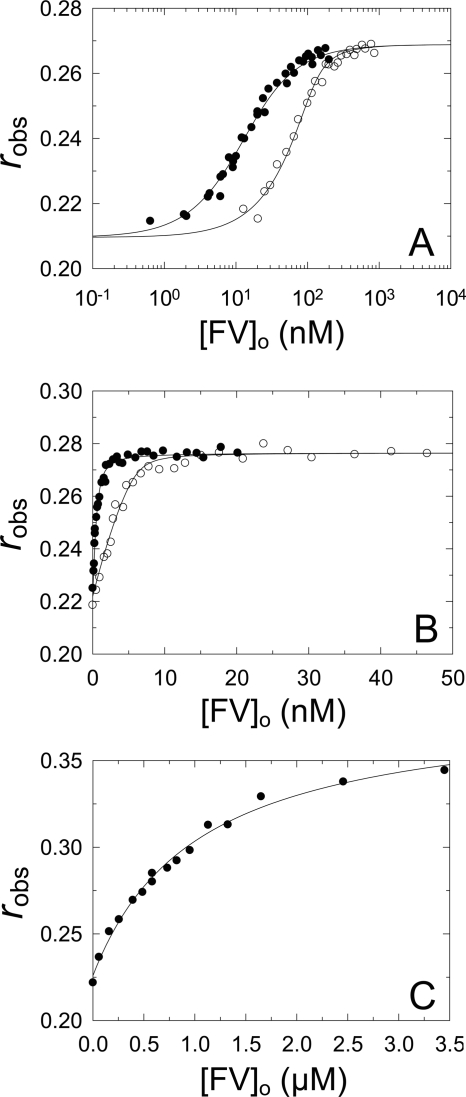
FIGURE 3.
Binding of FV to [5F]FFR-NotD and [OG]EGR-FXa. A, observed anisotropy (robs) of 9 (●) or 150 nm (○) [5F]FFR-NotD as a function of total concentration of FV ([FV]o). B, observed anisotropy (robs) as in A in the presence of 50 μm PC/PS SUVs and 1 (●) or 9 nm (○) [5F]FFR-NotD. C, observed anisotropy (robs) of 10 nm [OG]EGR-FXa in the presence of 350 μm PC/PS/PE SUVs as in A. The solid line represents the fit by the quadratic binding equation with the parameters given in Table 1. Anisotropy titrations were performed and analyzed as described under “Experimental Procedures.”

