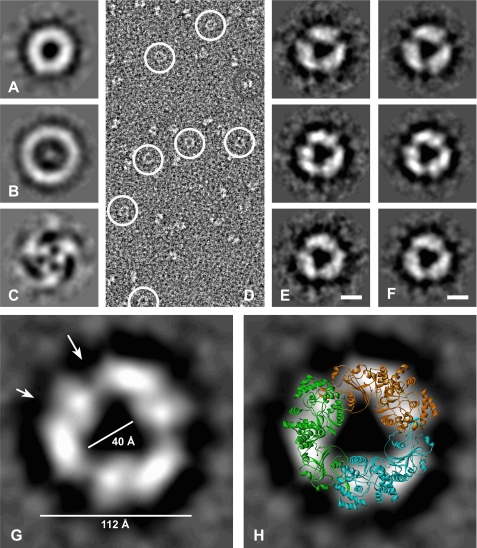
FIGURE 3.
Analysis of LASV NP complexes by EM. A–C, eigenimages obtained after alignment and multivariate statistical analysis of negatively stained raw images shown in D. D, raw electron micrograph. Circular views are circled in white. Another particle view is circled in gray. E, class averages obtained after alignment and multivariate statistical analysis. Scale bar = 5 nm. F, views corresponding to the class averages shown in E but with 3-fold symmetry applied. Scale bar = 5 nm. G, larger magnification of the class average shown in F (middle panel). The large and small arrows mark the presumed monomer interface and nucleotide-binding cavity in the N-terminal domain, respectively. H, overlay of the symmetric trimer from the crystal structure onto the class average view shown in G.

