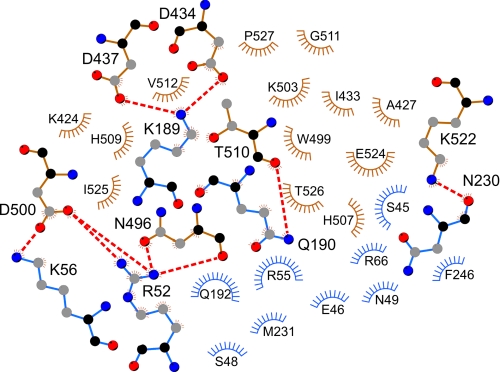
FIGURE 6.
Presumed noncovalent interactions at the head-to-tail interface in the symmetric NP trimer. The plot was created using the atomic coordinates from the crystal structure and the program LIGPLOT (46). The residues in the C-terminal domain of one partner are in brown; those in the N-terminal domain of the interacting partner are shown in blue. Arcs with radiating spokes indicate residues involved in hydrophobic interactions. Residues forming salt bridges or hydrogen bonds are shown in ball-and-stick representation; dashed red lines depict the bonds. Black, main chain carbon atoms; gray, side chain carbon atoms; red, oxygen atoms; blue, nitrogen atoms.

