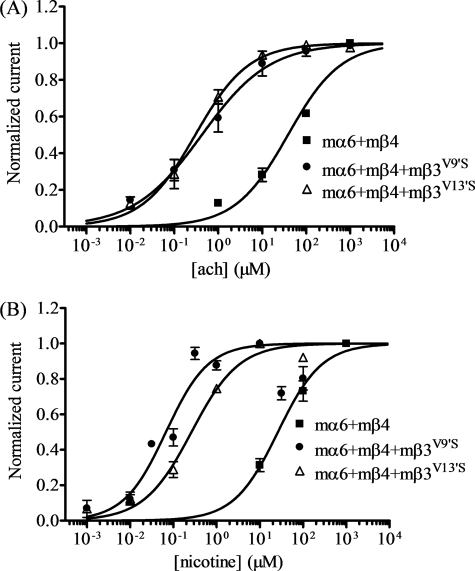
FIGURE 3.
Functional properties of mα6mβ4*-nAChR. Results averaged across experiments were used to produce concentration-response curves (ordinate − mean normalized current ± S.E.; abscissa − ligand concentration in log μm) for responses to ACh (A) or nicotine (B) as indicated for oocytes expressing nAChR mα6 and mβ4 subunits alone (■) or with either mβ3V9′S (●) or mβ3V13′S (△) subunits. Leftward shifts in agonist concentration-response curves are evident for functional nAChR containing mβ3V9′S or mβ3V13′S subunits (p < 0.0001; ∼91- and ∼130-fold, respectively, for ACh and ∼370- and 100-fold, respectively for nicotine). See Table 1 for parameters.

