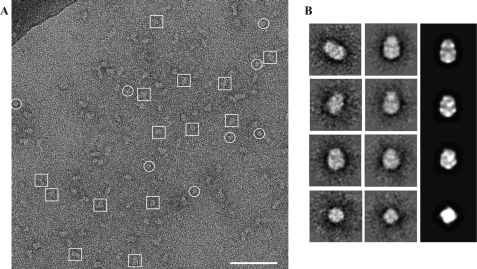
FIGURE 3.
Single-particle electron microscopy of TRPA1 in A8-35 amphipol. A, representative CCD image of purified TRPA1 rendered soluble by exchange into A8-35 and subsequently stained with 1% uranyl acetate on a carbon-coated copper grid. A distribution of “side views” (boxes) and “top views” (circles) are indicated. Scale bar = 70 nm. The darkened top left corner is a portion of the grid bar. B, representative selections of reference-free class averages (left panel), four-fold symmetry imposed class averages (center panel) and their back-projections (right panel).

