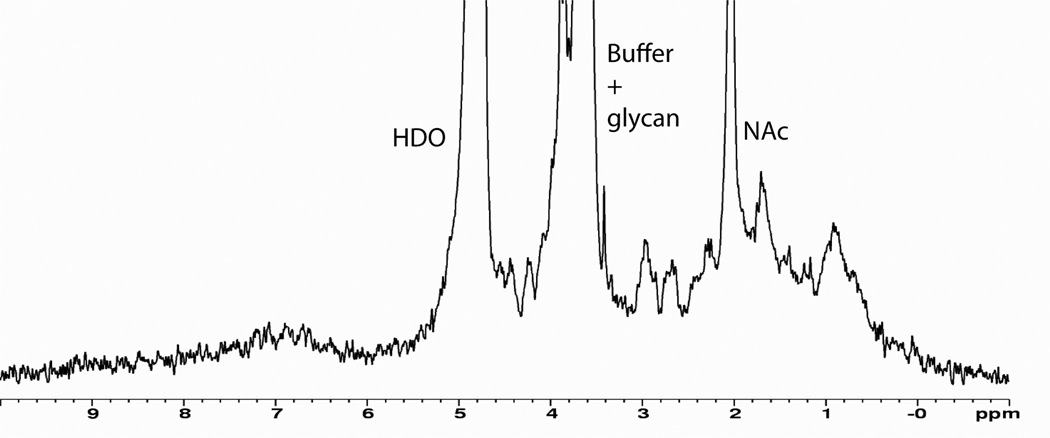
Figure 2.
300 MHz proton spectrum of α1-acid glycoprotein in 90% D2O. At 3.4–4.2 ppm, there is a large contaminating buffer peak in addition to carbohydrate resonances. The envelope of the protein amino acid resonances can be seen. The large singlet at ~ 2ppm is from the methyl protons of N-acetyl groups on some of the sugars (N-acetylglucosamine, N-acetylneuraminic acid).

