Fig. 1.

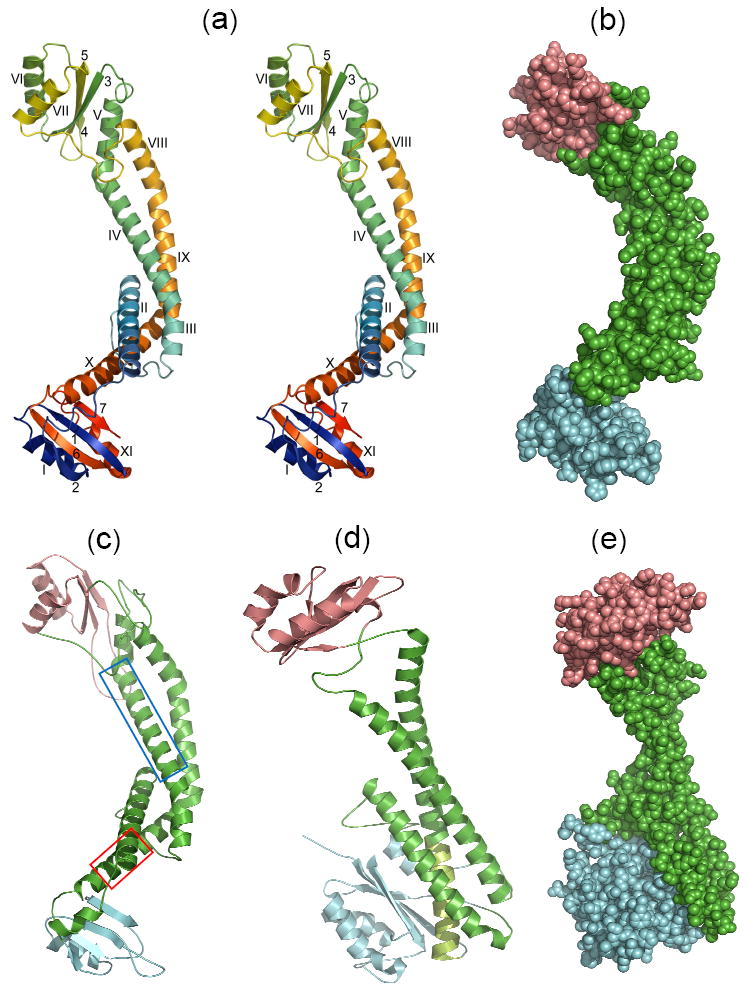
X-ray and modeled structures in similar orientations. (a) Stereoview of the ribbon backbone trace of the Icyt crystal structure color ramped from the N- to the C-terminal ends, and α-helices and β-sheet strands identified with Roman and Arabic numbers, respectively. Superposition of the distal (top) and proximal (bottom) lobes showed an rmsd of 5.3 Å over 23 α-carbons. (b) Space-filling representation of Icyt structure. The long linker region of anti-parallel pairs of α-helices is colored green, and the distal and proximal lobes are distinguished by salmon and cyan colors, respectively. These distinctions are adopted in c to e. (c) Model of acyt of the neuronal zebrafish subunit a1 obtained as described in the Supplementary Methods and Table S3. The α-helices boxed in blue (αV) and red (αX) in the sequence alignment which are equivalent to Icyt’s αIV and αX, respectively, have been implicated as sites for binding of t-SNARE protein syntaxin or SNAP259 and Ca2+-calmodulin, correspondingly30 (described further in Supplementary Fig. S3). (d) Ribbon trace and (e) space-filling representation, of the yeast subunit C (Vma5p) crystal structure (PDB 1U7L).14 The match from the DALI database13 between Icyt and subunit C structure gave Z score of 6.8 and rmsd of 10.1 Å over 216 aligned residues and sequence identity of 7%. A large substructure is formed by extensive hydrophobic interactions of the C-terminal segment of the longest α helix (light green) of the linker with the inner face of β-sheet of the foot domain (blue).
