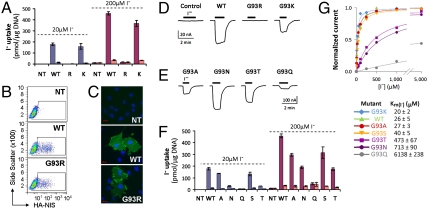
Fig. 1.
Analysis of G93 NIS substitutions in COS-7 cells and X. laevis oocytes. (A) Steady-state I- transport in WT, G93R, or G93K NIS-transfected COS-7 cells. Cells were incubated with 20 μM I- in the absence (blue bars) or presence (light blue bars) of 80 μM  , or with 200 μM I- in the absence (red bars) or presence (pink bars) of 800 μM
  . Values shown (pmol I-/μg DNA ± SD) are from one of at least five different experiments and corrected for transfection efficiency. (B) Flow cytometry under nonpermeabilized conditions with an Ab against the extracellular HA epitope at the NIS Nt, showing WT (19%) and G93R NIS (15%). (C) HA immunostaining of WT and G93R NIS under nonpermeabilized conditions. NIS is stained with Alexa 488 (green) and nuclei with DAPI (blue). Red scale bar = 20 μm. (D and E) Current traces are shown in response to 5 mM I- in (D) control (water-injected) X. laevis oocytes or oocytes expressing WT, G93R, or G93K NIS, or (E) G93A, N, T, or Q NIS. The evoked inward currents represent NIS-mediated electrogenic Na+/I- cotransport into the cell. Vm = -50 mV. (F) I- transport as in A in COS-7 cells transfected with WT, G93A, N, Q, S, or T NIS cDNAs. (G) Kinetics of I- transport by WT and G93K, A, S, T, N, and Q NIS. [Na+]o = 100 mM and Vm = -50 mV. For each mutant, the current values were normalized to the maximum current obtained at saturating [I-]. The smooth lines are fits of the data to the Michaelis–Menten equation. Values represent the means ± SE from at least four oocytes.

