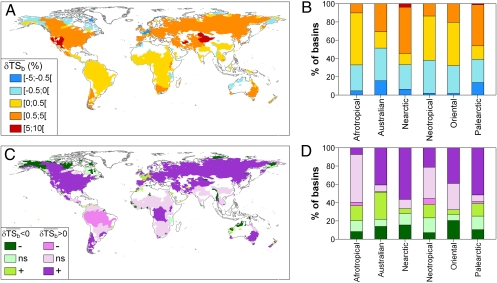
Fig. 4.
World maps showing the mean change in taxonomic similarity between each basin and the other basins belonging to the same realm ( ). The direction and intensity of change from the historical situation to the current situation (A) and the proportion of basins in each class of
  per realm (B) are shown. (C) Significance of the observed taxonomic homogenization or taxonomic differentiation against a null model testing random native species extirpation and nonnative species introduction. The “+” symbol indicates that the changes observed in taxonomic similarity are significantly greater than expected under the null hypothesis (P > 0.975), whereas the “−” symbol indicates that the changes observed in taxonomic similarity are significantly lower than expected under the null hypothesis (P < 0.025). ns indicates that the changes observed in taxonomic similarity are not significantly different from the values expected under the null hypothesis. (D) Per realm proportion of basins in each level of significance of
  .
.

