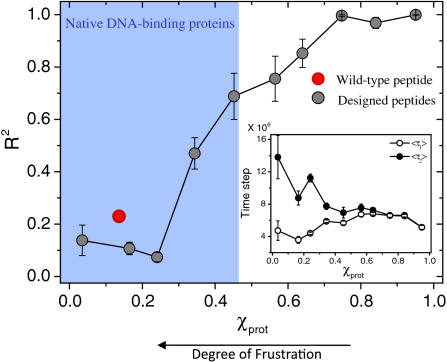
Fig. 5.
Interplay between frustration and the kinetics of target site search. Histogram of R2 (the correlation coefficient between τ1 and τ2; see Fig. 4) for the χprot values of the library of 150 MAD recognition helix variants is shown. Target localization and binding are significantly more correlated (R2 ∼ 1) in proteins with higher χprot values. The region shaded in blue marks the range of χprot values obtained from the dataset of natural DBPs, and the red circle corresponds to the wild-type peptide of the MAD recognition helix. Peptides with lower χprot values (i.e., with higher frustration between their specific and nonspecific binding modes) are characterized not only by a weak correlation between τ1 and τ2 but also by a gap between the two time scales (Inset) that disappear for less frustrated peptides.

