Fig. 1.
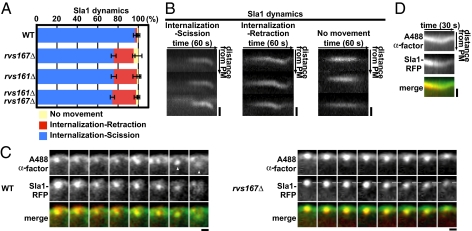
Endocytic vesicle scission assay. (A) Sla1-GFP dynamics in rvs167Δ and rvs161Δ mutants. Blue, red, and yellow bars represent the percentages of patches that were internalized followed by scission, that were internalized followed by retraction to the plasma membrane (PM), and that did not internalize, respectively. (B) Kymographs of single patches from movies of Sla1-GFP in an rvs167Δ mutant. Three patterns described in A are displayed. Each panel shows three individual patches. (Scale bars: 400 nm.) (C) Colocalization of fluorescent α-factor with internalizing (WT cells) and retracting (rvs167Δ mutant cells) Sla1-RFP patches. The time series shows the position of endocytic patches from movie frames (1 frame per second). Images from 3-s intervals are shown. (Left) White arrowheads represent a released endocytic vesicle in WT cells. (Right) Dashed lines represent the position of Sla1-RFP origin parallel to the PM. (Scale bars: 200 nm.) (D) Kymograph representations of fluorescent α-factor and Sla1-RFP for a single patch in an rvs167Δ mutant from a two-color movie (1 frame per second). (Scale bar: 200 nm.)

