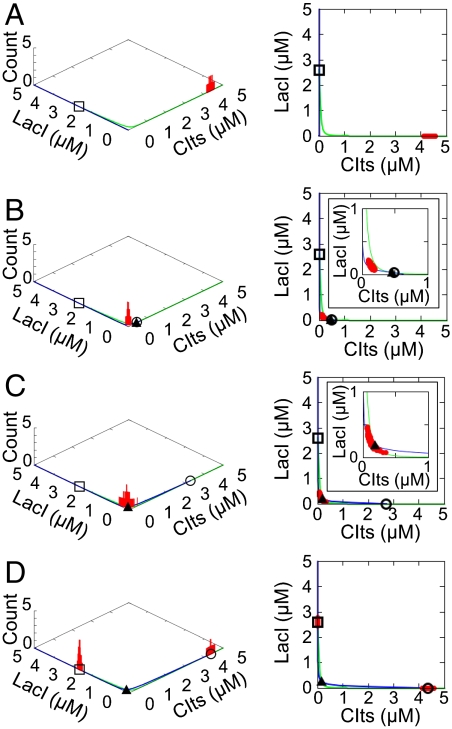
Fig. 2.
Numerical predictions of the dynamic behavior in the diversity-generator cells. The cell-population histograms and the nullclines (Left), with their two-dimensional projections (Right). Blue and green lines represent nullclines of ordinary differential equations for [CIts] and [LacI], respectively. The open squares, open circles, and closed triangles indicate the high stable, low stable, and unstable steady states, respectively. Insets are enlarged views around the unstable steady state. (A) Cells are set in the low state, and the AHL concentration in the medium is zero. (B) Accumulation of AHL causes the bifurcation, so that the high stable and unstable steady states appear. (C) The position of the unstable steady state is in the cell population. (D) The cell population finally exhibits a bimodal distribution. All parameters used for the simulation are listed in Table S2.

