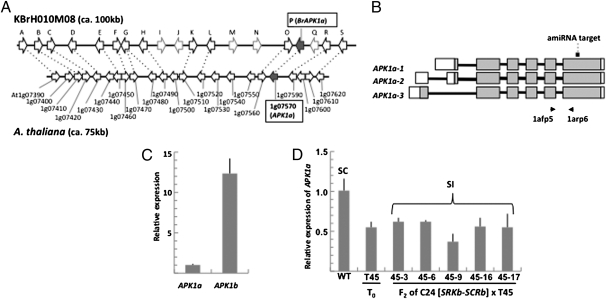
Fig. 2.
Expression analysis of AtAPK1a-suppressed plants. (A) Synteny of APK1a-containing chromosomal regions in Brassica and A. thaliana. E-values are listed in Table S5. (B) Structure of the AtAPK1a gene showing its three alternative transcript forms and the location of the sequence targeted by the artificial microRNA (amiRNA target) designed to down-regulate the gene. The arrows below the diagram indicate the location of the primer pairs used for transcript quantitation. (C) Quantitative real-time PCR analysis of AtAPK1b and AtAPK1a transcripts in the stigmas of WT C24 stigmas. (D) Quantitative real-time PCR analysis of AtAPK1a transcripts in the stigmas of WT C24, the T45 AtAPK1a-suppressed primary transformant, and F2 plants derived from crossing T45 with C24[SRKb-SCRb]. All of the F2 plants analyzed contain the SRKb-SCRb transgenes but express AtAPK1a transcripts at lower levels than WT. For all real-time PCR experiments, relative gene expression levels were generated by normalizing the signal using the ubiquitin-conjugating (UBC) gene (At5g25760). SDs from triplicate experiments are indicated by error bars.

