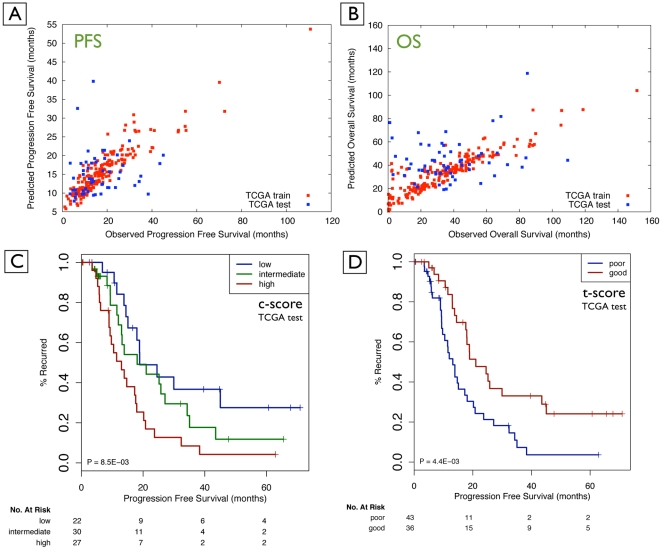
Figure 3. Quality of outcome prediction for survival time (A, B) and discrete risk categories (C, D).
(A) Prediction of time-to-event (PFS; un-censored data); (B) prediction of time-to-event (OS; un-censored data); (C) statistically significant stratification into low-, intermediate- and high-risk patients using the prediction method for TCGA test data based on c-score (Integrated PFS signature); and (D) stratification for the TCGA test data based on t-score (Integrated PFS signature).

