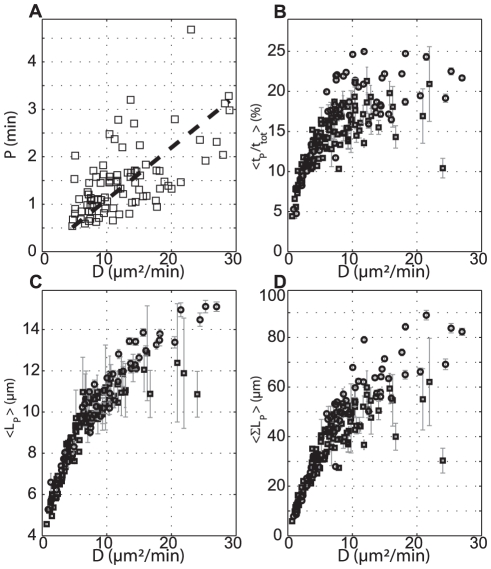
Figure 2. Cell persistence is correlated with Diffusion Coefficient D.
All variables are plotted as a function of  which is obtained (as well as the persistence time
  ) by fitting
  with the Fürth's formula at long times (
 ). (A) Persistence time
  (values larger than the time interval of 30 sec were considered); (B–C–D) Parameters obtained from a bimodal analysis; (B) Ratio of time spent in persistent mode over total tracking time; (C) Length of persistence
  (distance end-to-end of each individual persistent portion of cell trajectory); (D) cumulative
  , summed over all cell trajectory. Squares correspond to ‘Aging’ experiments, circles to Flow experiments.
  denotes averaging over all tracked cells in a given condition. Error bars represents SEM. The solid line in (A) is a linear fit
  (
( ,
,  ).
).

