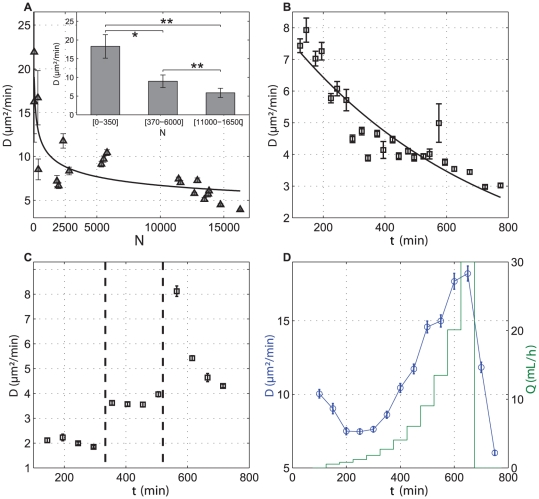
Figure 3. Cell motility depends on a QSF secreted by cells.
The diffusion coefficient  is decreasing with cell density and experimental time, highlighting the role played by a QSF factors in cell motion. Error bars represent SEM. (A)
  plotted as a function of the experimental cell density. Cells were recorded during 50 min, 1.5 hours after cells were washed in a fresh HL5 medium. Inset: Average
  values and corresponding
  error bars obtained for different cell density ranges; (B) ‘Aging’ assay: as time increases QSF increases and
  decreases; (C), Evolution of
  when medium is changed during experiment starting from Highly conditioned Medium (left part, during time [150–300 min], low
  ), moderate conditioned medium (middle part, during time [350–500 min], intermediate
  ) and fresh medium (right part, during time [550–700 min], rapid increase in
  , followed by an exponential decrease); (D) Evolution of
  with flow
  . A home-made macrofluidic chamber enables renewing the flow. Applied flow is changed with exponential step (green line, vertical right axis).
  is first decreasing (corresponding to a state where QSF cell emission is overcoming QSF flow dilution), then increasing (corresponding to a state where QSF flow dilution is overcoming QSF cell emission). When flow is stopped after 700 min,
  rapidly decreases (corresponding to a rapid increase in QSF concentration).

