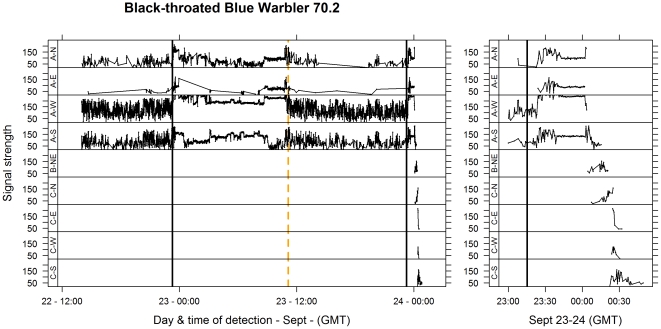
Figure 2. A probable migratory departure for a Black-throated Blue Warbler.
Variation in signal strength (arbitrary scale from 0–255) by multiple antennae on three towers (see Figure 1 for locations) is plotted by time. Black vertical lines are sunset; orange dashed lines are sunrise. Left most panel shows all detections in ∼48 h prior to departure; the right panel repeats the last ∼70 minutes of detection (during departure) on an expanded time scale. Reading from left to right (left hand panel), the individual is active up to sunset (high variation in signal strength) and relatively inactive during the night (low variation in signal strength). At sunset on 24 Sept (right hand panel) there is a rapid increase followed by a short period (∼30 min) of low variation in signal strength suggesting the individual moved to a more exposed location just prior to initiating a migratory flight of ∼35 min. The migratory flight is shown by a sharp increase in signal strength at ∼0015 (see peaks on A–S and A–N antennas), followed by detections on tower B and C situated to the South. Final detections show declining signal strength on the C–S antenna suggesting that the individual flew directly south across Lake Erie.

