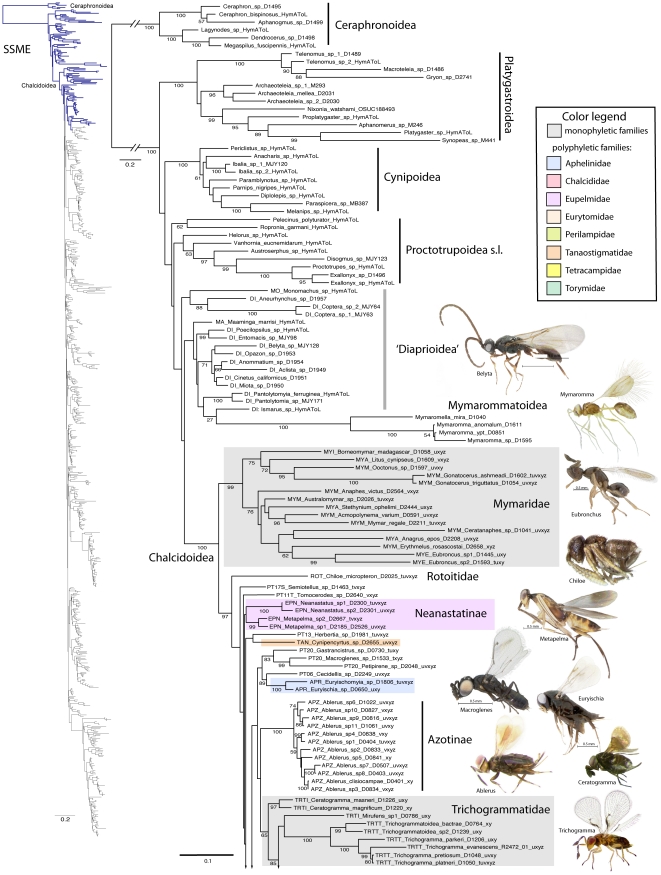
Figure 1. Phylogenetic tree from secondary structure alignment of stem data and E-INS-i alignment of RAAs (3917 aligned; SSME).
RAxML analysis with seed 38652 and 1000 rbs bootstrap replicates (support >50% above branches). Phylogram of entire tree on left colored to match inset. Taxon names with prefix indicating classification (see Table 3) and suffix indicating DNA voucher number and gene regions included for 18Sa-c (tuv) and D2 (x), D3 (y) and D4-5 (z). Monophyletic families indicated by gray shading; polyphyletic families other than Pteromalidae indicated according to inset color scheme.

