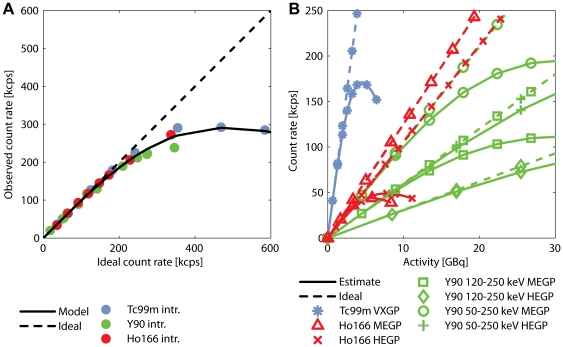
Figure 3. Intrinsic and system count rate linearity curves.
(A) The observed count rate is plotted as a function of ideal count rate. Sorensen's count rate model for paralyzable cameras (solid line) is fitted to the intrinsic count rate measurements (data points). The ideal camera count rate response, without dead-time effects, is plotted by the dashed line. (B) Shown are the system count rate curves (solid lines), composed of the intrinsic count rate linearity curve and the system sensitivity measurements. The slope of the ideal system camera count rate response (dashed lines) corresponds to the system sensitivity.

