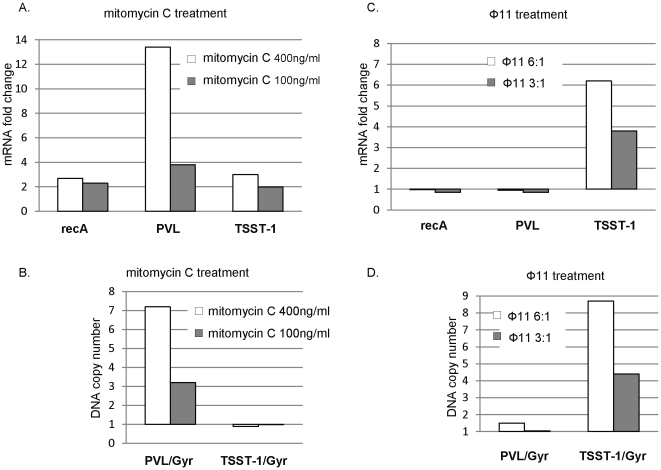
Figure 9. Comparative study of phage induction versus gene transcription in response to mitomycin C or phage 11 treatment.
(A. and B.) Bacteria were treated with mitomycin C (400 ng/ml or 100 ng/ml) for 1 hr. (C. and D.) Freshly prepared phage 11 was added for 1 hr. One half of samples were used for RNA preparation followed by a quantitative RT-PCR analysis. Fold changes in gene expression of recA, PVL and TSST-1 were normalized to the internal control gene gyrase (Gyr) and relative to no treatment control sample. The other half of samples were used for total genomic DNA preparation. Relative copy number of TSST-1 or PVL gene versus Gyr were calculated as described in Materials and Methods. Shown is one representative out of three independent experiments, all of which gave comparable results.

