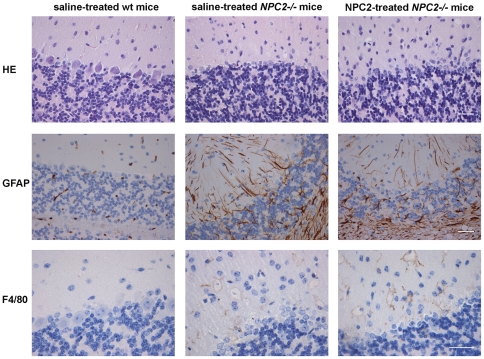
Figure 9. Histochemical and immunohistochemical staining of cerebellum.
Staining of representative cerebellum sections from saline-treated wild type mice (left panels), saline treated NPC2−/− mice (middle panels), and NPC2 treated NPC2−/− mice (right panels). Hematoxylin-eosin (H&E) staining (first row), immunohistochemical GFAP-staining for detection of astrocytes (brownish) (second row), and immunohistochemical localisation of antigen F4/80 positive macrophages (brownish) (third row). Data are representative of three separate experiments. n = 3 animals in each experimental group. Scale bars represent 30 µm.

