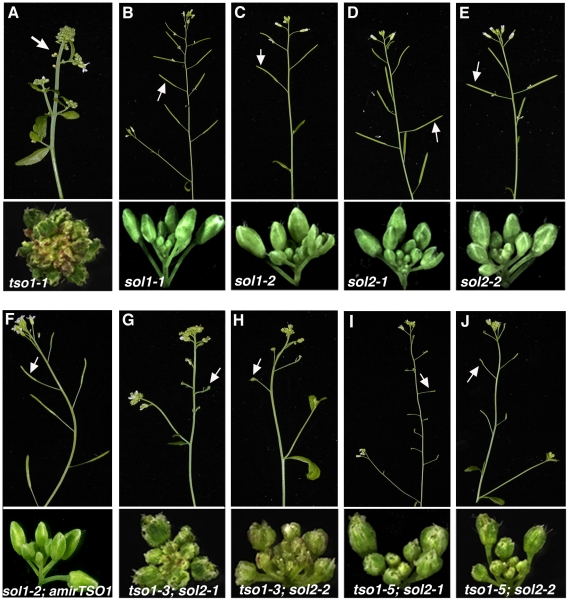
Figure 5. sol2, but not sol1, showed synergistic genetic interactions with tso1 class II alleles.
Each panel consists of the top portion showing fertility phenotypes and bottom portion showing flower and inflorescence phenotypes. (A) tso1-1. (B–E) Fully fertile siliques and morphologically normal inflorescences developed in sol1-1 (B), so1-2 (C), sol2-1 (D), and sol2-2 (E) single mutants. (F) A sol1-2; amiRTSO1 inflorescence showing wild type phenotype. (G–J) tso1; sol2 double mutant plants showing an absence of silique and abnormal inflorescences of tso1-3; sol2-1 (G), tso1-3; sol2-2 (H), tso1-5; sol2-1 (I), and tso1-5; sol2-2 (J).

