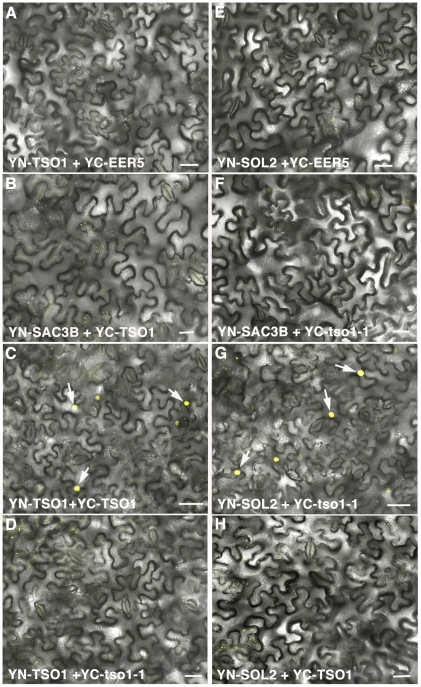
Figure 6. BiFC analyses showing TSO1 to TSO1 as well as tso1-1 to SOL2 interactions.
Interactions were detected by YFP reconstitution between the YN and YC fusion proteins, leading to yellow fluorescence shown by single confocal section images overlaid with Nomarsky differential interference contrast (DIC) images. YC-EER5 and YN-SAC3B nuclear proteins serve as negative controls as they function in unrelated processes from TSO1 or SOL2 [39]. Arrows point to nuclei expressing YFP fluorescence. Scale bars represent 50 µm. (A–B) Negative control combination of YN-TSO1 with YC-EER5 (A), or YN-SAC3B with YC-TSO1 (B). (C) Positive interaction between YN-TSO1 and YC-TSO1 indicated by fluorescent nuclei (arrows). (D) An absence of interaction between YN-TSO1 and YC-tso1-1 indicated by an absence of fluorescent signals. (E–F) Negative control combination of YN-SOL2 with YC-EER5 (E), or YN-SAC3B with YC-tso1-1 (F). (G) in vivo interaction between YN-SOL2 and YC-tso1-1 shown by fluorescent nuclei (arrows). (H) An absence of interaction between YN-SOL2 and YC-TSO1.

