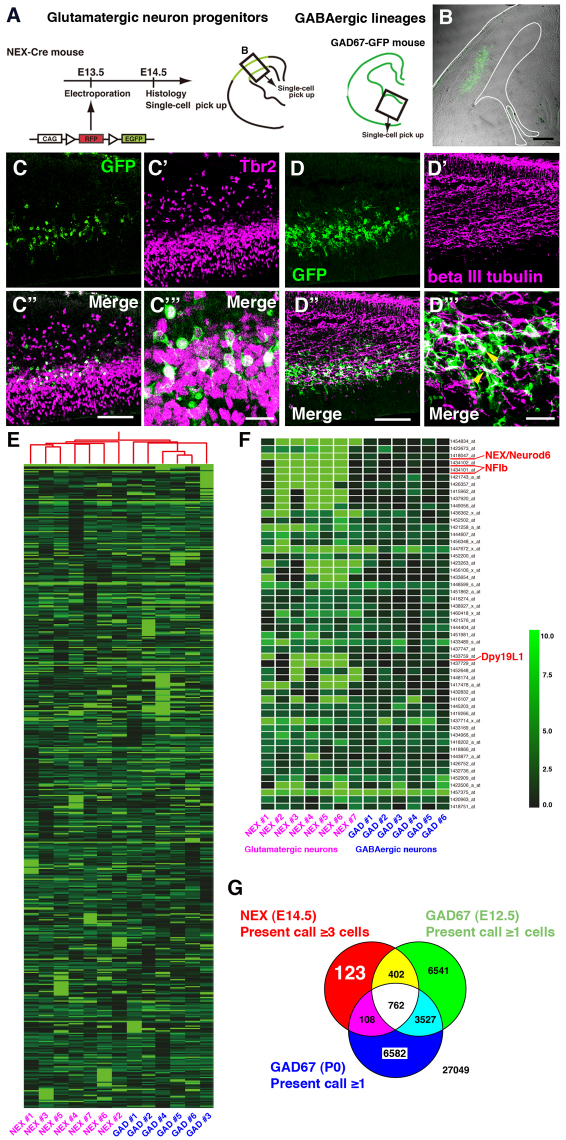
Fig. 1.
Subtraction screening of cortical glutamatergic neuron-specific genes by single-cell microarray. (A) The labeling procedure for glutamatergic or GABAergic neuron lineage cells. (B) Localization of GFP-positive cells in the NEX-Cre cerebral cortex 24 hours after electroporation with a reporter plasmid. The border of the section is outlined. (C-D″′) Immunohistochemistry of cortical sections of E14.5 NEX-Cre mouse embryos labeled with a GFP reporter showing overlay of Tbr2 (C-C″′) or beta III tubulin (D-D″′) and GFP. C″′ and D″′ show magnified images. Yellow arrowheads indicate cells positive for GFP and beta III tubulin. (E) Cluster analysis. Distinct gene expression profiles for glutamatergic and GABAergic neuron lineage cells were detected. (F) Expression levels of genes strongly expressed in glutamatergic neuronal lineage cells. (G) We selected 123 genes that were specifically expressed in glutamatergic neurons by filtering with present/absent calls. Scale bars: 200 μm in B; 100 μm in C-C″ ,D-D″ ; 20 μm in C″′,D″′.

