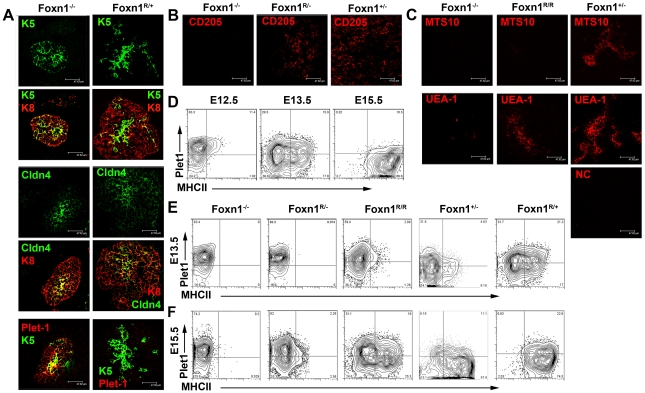
Figure 5. Divergence of the mTEC lineage is Foxn1-independent.
Images show representative sections from (A) E13.5 thymic primordia after staining for K5 and K8, Cldn4 and Plet-1. (B,C) E15.5 thymic primordia after staining for CD205 and panK (B) or MTS10, UEA-1 and panK (C). Scale bars 47.62 µm. Genotypes of embryos are as designated. Note that the medullary lineage markers Cldn4, K5 and UEA1 are expressed in Foxn1-/- thymi. Bottom right image in (C) shows negative control (NC) for UEA1 stain (Streptavin-Alexa647). Data shown are representative of at least three independent experiments. (D-F) Plots show staining of (D) wild type thymic primordia from E12.5, E13.5 and E15.5 mice, (E) E13.5 and (F) E15.5 mice of the genotypes shown after staining with anti-Plet-1 (MTS20) and anti-MHC Class II (MHCII). All plots show data obtained after gating on EpCAM+ cells. The data shown for Foxn1-/-, Foxn1+/-, and E13.5 Foxn1R/- mice are representative analyses of individual thymic primordia, all other plots show analyses on pooled samples from several embryos. n≥3 for all genotypes. Relative proportions of EpCam+Plet-1+ cells in Foxn1-/- and Foxn1R/- mice: E13.5: Foxn1R/-, 70.8±16.0%; Foxn1-/-, 74.3±7.6%. E15.5: Foxn1R/-, 59±7.9%; Foxn1-/-, 73.8±13.3%; Foxn1R/- versus Foxn1-/- p = 0.74 (E13.5), p = 0.06 (E15.5).

