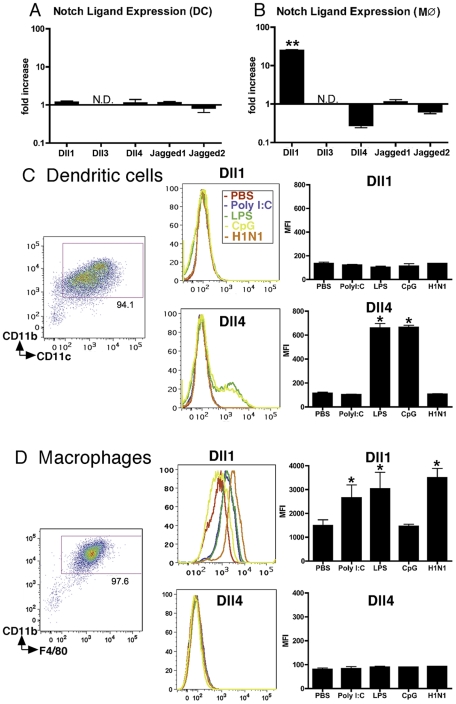
Figure 1. BMDMs, but not BMDCs, exhibit increased expression of Dll1.
BM-derived DCs (BMDCs) (A) and BMDMs (M ) (B) were stimulated with H1N1 (MOI = 10) for 6 hours, then quantitative real-time PCR was performed and the expression levels of Notch ligands were evaluated. BMDC (CD11b+CD11c+) (C) and BMDM (CD11b+F4/80+) (D) were stimulated with PolyI:C (10 µg/ml), LPS (1 μg/ml), CpG (1 µM), or H1N1 (MOI = 10) for 24 hours, then flow cytometry was performed as indicated in MATERIALS and METHODS. *P<0.05, **P<0.01 compared with PBS-treated cells. Data shown indicate mean±SEM and are from a representative experiment of 3 independent experiments. Each time point represents at least 4 mice per group. N.D. = No Detection, MFI = Mean Fluorescence Intensity.

