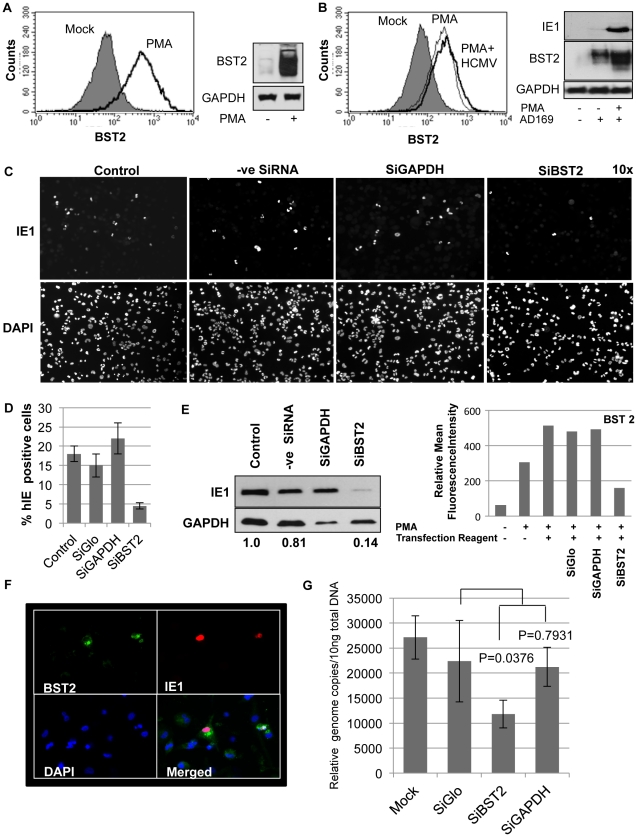
Figure 5. Infection of THP-1 cells with HCMV is BST2-dependent.
A) Surface levels of endogenous BST2 upon treatment of THP-1 cells with PMA for 24 hours (left panel) and immunoblot for total BST2 present upon PMA induction (right panel) . B) FACS and immunoblot analysis of THP-1 cells treated with PMA and upon infection with HCMV-AD169. C) IFA of IE1 in PMA-differentiated THP-1 cells treated with indicated siRNAs and infected with HCMV-AD169 for 24 h. Representative fields are shown as 10× magnified frames. D) IE1 positive-cells and DAPI-positive cells were counted from 5 fields using Image J (http://rsbweb.nih.gov/ij/). The average ratio of infected versus total number of cells is shown. E) IE1-immunoblot analysis of a similar experiment as in C. GAPDH-normalized band intensities are given below the bands. The efficiency of BST2 knock down is represented as mean fluorescence intensity of BST2 on the cell surface by flow cytometry analysis. F) IFA of HCMV-infected THP-1 cells treated with low amounts of BST2-siRNA resulting in residual cells expressing BST2. At 24 hpi the cells were probed for BST2, IE1 and DAPI. G) Relative genome copies of HCMV TR at 90 min post-infection of PMA activated THP-1 cells treated with indicated SiRNAs for 72 h. To remove extracellular virus, cells were washed with citric acid buffer (pH = 3) prior to harvesting.

