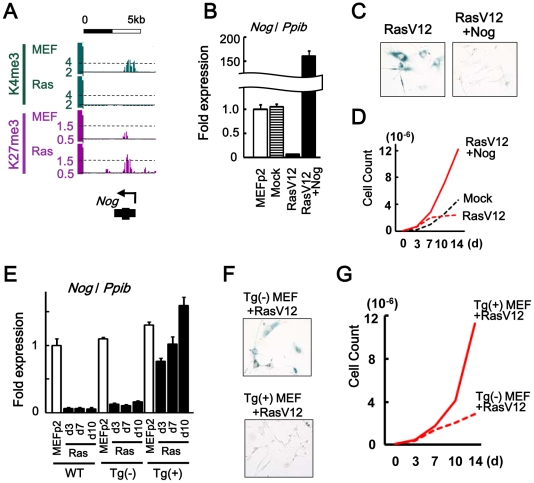
Figure 5. Nog repression in senescence.
(A) Maps around TSS of Nog, showing increase of H3K4me3 and decrease of H3K27me3. (B) Real-time RT-PCR analysis of Nog, showing repression to 0.06-fold in RasV12 cells, and overexpression to 159-fold in Nog-introduced RasV12 cells. (C) SA-βgal staining. The number of SA-βgal(+) cells were decreased in Nog-introduced RasV12 cells compared with RasV12 cells. (D) Growth curve. Nog-introduced RasV12 cells showed continual growth. (E) Real-time RT-PCR analysis. WT, wild-type C57/B6 MEF. Tg(-), Krt19-Nog transgene (-). Tg(+), Krt19-Nog transgene (+). Nog was repressed to 0.09–0.15 fold by RasV12 infection in Tg(-) MEF, similar to wild type MEF. Nog expression in Tg(+) MEF was detected at physiological level, and was not repressed by RasV12 infection. The increase of Nog expression from day 3 to day 10 might be due to selection. (F) The number of SA-βgal(+) cells were less in Tg(+) MEF than Tg(-) MEF after RasV12 infection. (G) Tg(+) MEF showed faster growth compared to Tg(-) MEF, after Rasv12 infection.

