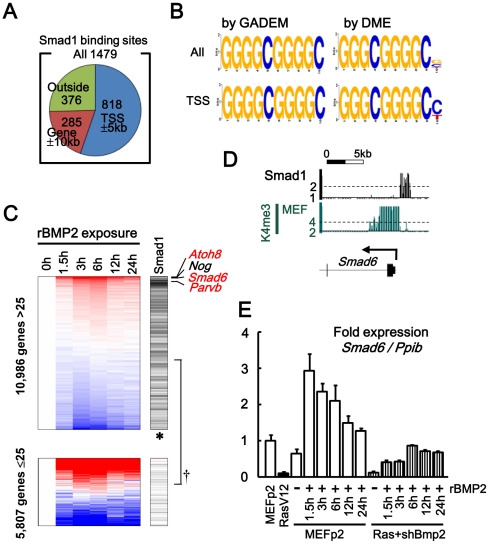
Figure 7. Smad1 targets in MEF, analyzed by ChIP-sequencing.
(A) Among 1,479 Smad1 binding sites identified, 1,103 sites (75%, blue and orange) were located within 10 kb from 20,232 RefSeq genes, and 818 sites (55%, blue) were within 5 kb from their TSS. (B) GGGGCGGGGC was obtained as an enriched motif by GADEM [32], in Smad1 binding region within both whole genomic (All, ln(E-value) = −279.2) and TSS regions (TSS, ln(E-value) = −115.8). Very similar motifs were obtained by DME [33]. (See also Figures S9 and S10) (C) Correlation of Smad1 binding to gene upregulation. Left, expression levels in MEF at 0–24 hours after rBMP2 exposure. Genes were sorted by fold-expression level between 0 h and the mean of 3 h and 6 h. Right, 838 genes possessing Smad1 binding site in TSS region (black bars). Upper panel, genes with maximum GeneChip score during 24 h >25 (i.e. active genes). Lower panel, genes with maximum GeneChip score <25. Smad1 binding was significantly enriched in the upper panel of active genes (†P = 2×10−57, Fisher’s exact test), especially upward within the upper panel (thus genes upregulated by rBMP exposure, *P = 2×10⁻¹¹, Kolmogorov-Smirnov test). Most upregulted genes included Atoh8, Smad6, Parvb (red, Smad1 target), and Nog (black, non-Smad1-target). (D) Smad1 binding site around Smad6 TSS. (E) Real-time RT-PCR showing Smad6 upregulation in MEF by rBMP2 exposure. In Bmp2-knocked-down RasV12 cells, Smad6 was suppressed lower than the level in MEFp2 even when exposed to rBMP2.

