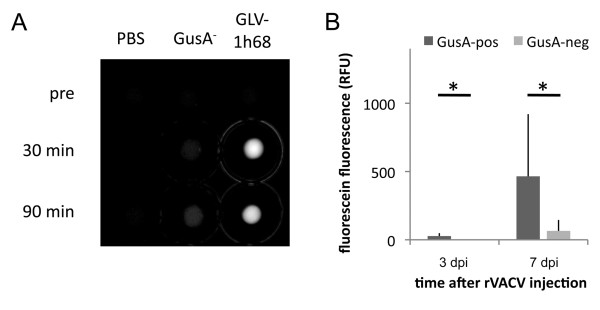
Figure 2.
Analysis of urine samples derived from mice before, 30 min and 90 min post FDGlcU injection respectively. A) Five μl urine were analyzed in the Maestro Imaging system. Unmixed fluorescein specific fluorescence is shown. B) Three and seven days post rVACV injection urine was sampled before and 90 min post FDGlcU injection. Average plus standard deviation of fluorescein specific fluorescence of GusA-positive (n = 6 for 3 dpi and n = 8 for 7 dpi) and GusA-negative (n = 4) rVACV colonized tumors. * indicates p < 0.05.

