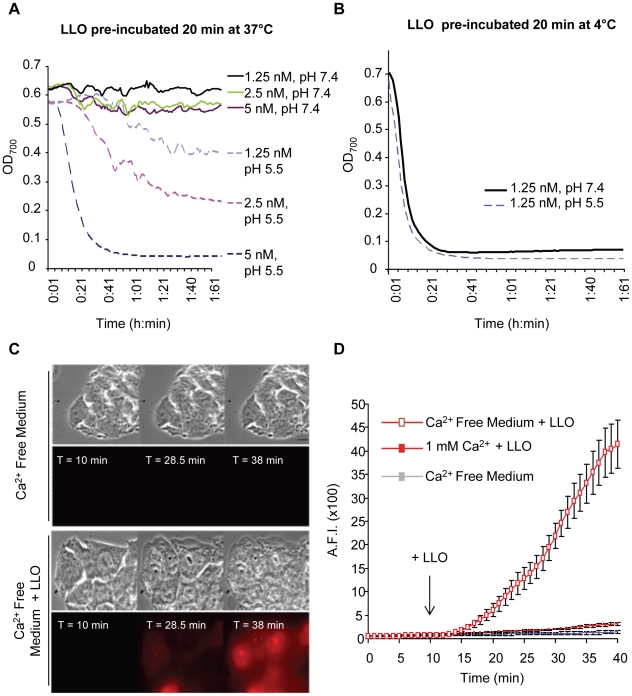
Figure 5. Extracellular LLO perforates erythrocytes and HepG2 cells at 37°C, pH 7.4.
LLO was diluted in PBS pH 7.4 or 5.5 at 4°C in a 96 well plate (20 µl toxin in each well). (A) The plate was incubated at 37°C for 20 min, then, 180 µl of a 37°C suspension of sheep erythrocytes (0.25%) in PBS pH 7.4 or 5.5 was added to each well. (B) The plate was kept on ice for 20 min, then, 180 µl of a 37°C suspension of erythrocytes (0.25%) in PBS pH 7.4 or 5.5 was added to each well. In (A) and (B) following addition of erythrocytes, the plates were incubated at 37°C in a Power Wave 340 spectrophotometer (Bio-Tek) and absorbance (700 nm) was acquired every min [102]. Results show representative experiments (of 3), each performed in duplicate. In (C) and (D), perforation of HepG2 cells was measured by quantitative live cell fluorescence microscopy. HepG2 cells were incubated on the microscope stage at 37°C for 40 min with ethidium homodimer and in the presence or absence of 1 mM calcium. Phase contrast and fluorescence images were recorded at regular time intervals using a 100X objective and LLO was added after 10 min of incubation. Results were expressed as the averagefluorescence intensity (in arbitrary units) in the cells ± SEM of 5 movies for each condition. Scale bar = 10 µm.

