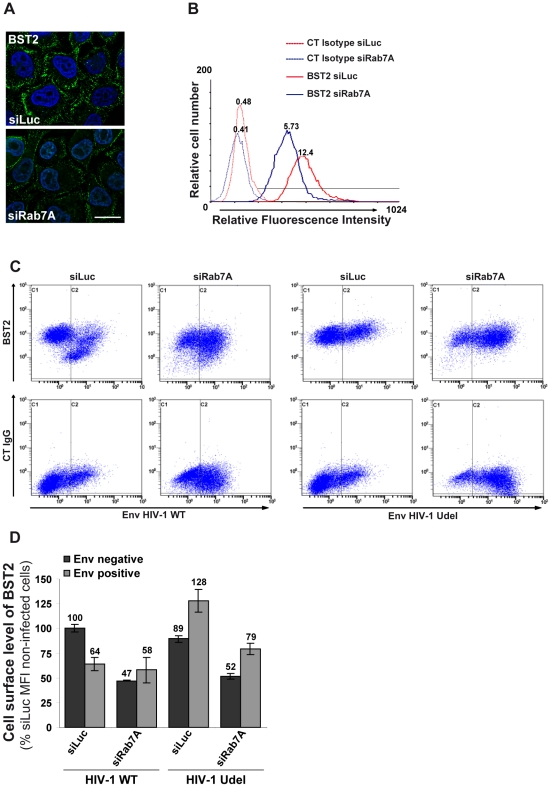
Figure 8. Rab7A decreases BST2 cell surface expression and is required for Vpu-induced BST2 cell surface downregulation.
(A–B) Rab7A decreases BST2 cell surface expression. HeLa cells were transfected with either siRNA control Luciferase (siLuc) or siRNA targeting Rab7A (siRab7A). (A) Forty-eight hours after transfection, cells were stained at 4°C with anti-BST2 antibody and appropriate fluorophore-conjugated secondary antibody. Cells were then fixed with PFA. Scale bars = 20 µm. (B) Forty-eight hours after transfection, cells were stained with a mouse monoclonal antibody against BST2 or isotype control mouse IgG1. Cells were then stained with Alexa 647-conjugated donkey anti-mouse antibody, fixed and processed for flow cytometry analysis. These data are representative of 3 independent experiments. (C–D) Rab7A is required for Vpu-induced cell surface downregulation of BST2. HeLa cells transfected with either control siRNA (siLuc) or siRNA targeting Rab7A were infected with VSV-G pseudotyped NL4-3 HIV-1 (WT or Udel) at a MOI of 0.5. Twenty-four hours later the cells were stained with mouse monoclonal antibody against BST2 (BST2; upper panels) or control mouse IgG1 as an isotype control (CT IgG; lower panels), along with human anti-Env antibody (2G12). The cells were then stained with Alexa 647-conjugated donkey anti-mouse and PE-conjugated donkey anti-human antibodies, fixed and processed for flow cytometry analysis. (C) Dot plot. Vertical lines indicate the gates set using non-infected cells stained as indicated. Gate C1 represents non-infected cells and gate C2 infected cells. These data are representative of 3 independent experiments. (D) Bar graph representation of the cell surface levels of BST2 (Mean of fluorescence Intensity; MFI) on Env negative cells (black bars) and Env positive cells (grey bars) for each siRNA condition. Bars represent the means of the MFI values ± SD from 3 independent experiments.

