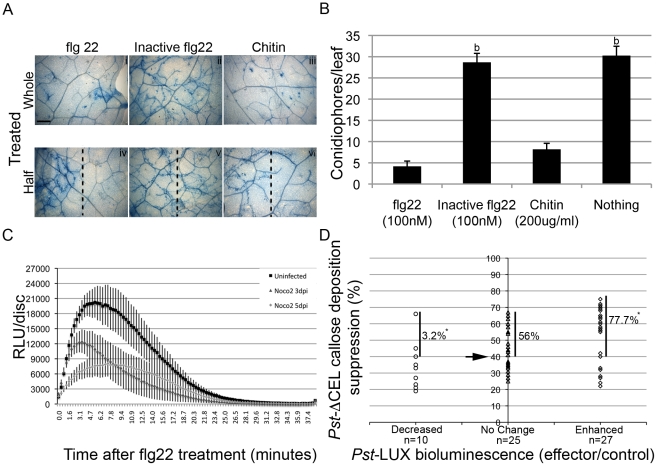
Figure 4. Suppression of PTI as a virulence tool for Hpa.
(A) Pre-treatment of Col-0 leaves with flg22 or Chitin reduces Hpa isolate Noco2 hyphal colonization. Leaves of four-week-old Col-0 plants were pre-infiltrated with 100 nM flg22, inactive flg22 (from A. tumefasciens) or Chitin (200 µg/ml) 24 h before inoculation of Hpa Noco 2 (5×10⁴ sp/ml). Pictures show trypan blue stained leaves at 5 days post-Hpa spraying (dps). This experiment was repeated three times with similar results and also for Emoy2 on Oy-0 plants. Panels i, ii and iii: the whole area shown was pre infiltrated. Panels iv, v and vi: only the right side of the picture was infiltrated. Dotted vertical line indicates approximated infiltration boundaries. Bar is 500 µm. (B) Pre-Induced PTI responses reduce Hpa asexual reproduction. Leaves of three-week old Col-0 plants were infiltrated with the indicated solutions 24 h before infection with Noco2 (5×10⁴ sp/ml). Conidiophores per leaf were counted on trypan blue stained leaves excised at 5 dps. Bars represent the average ±2× SE of 40 leaves. This experiment was repeated three times with similar results. (b) p value <0.01, T-test. (C) Hpa infected tissues show reduced ROS response to flg22. Leaf discs from uninfected and infected Col-0 plants were treated with 100 nM flg22, and the level of ROS generated measured with a Luminometer. Values indicated are average of Relative Luminescence Units (RLUs) ± SE of 24 leaf discs. (D) HaRxLs delivered by Pst-ΔCEL in Col-0 plants suppress callose deposition. Effector's impact on the level of Pst-ΔCEL-triggered callose deposition is presented in the Y-axis. The average reduction (in percentage) of callose deposits observed when a given candidate effector was delivered, compared to the number of callose deposits observed when control proteins were delivered by Pst-ΔCEL, is represented by the shapes in the body of the graph. HaRxLs were also categorized according to their phenotype on Pst-LUX bioluminescence in Col-0 (X-axis). The arrow indicates the threshold set up to consider callose deposition as significantly suppressed. The numbers in the body of the graph correspond to the percentage of HaRxLs able to suppress callose deposition among each bioluminescence category. (*) Indicates p<0.05 of Z-test versus random distribution expected for the number (n) of HaRxLs on each group.

