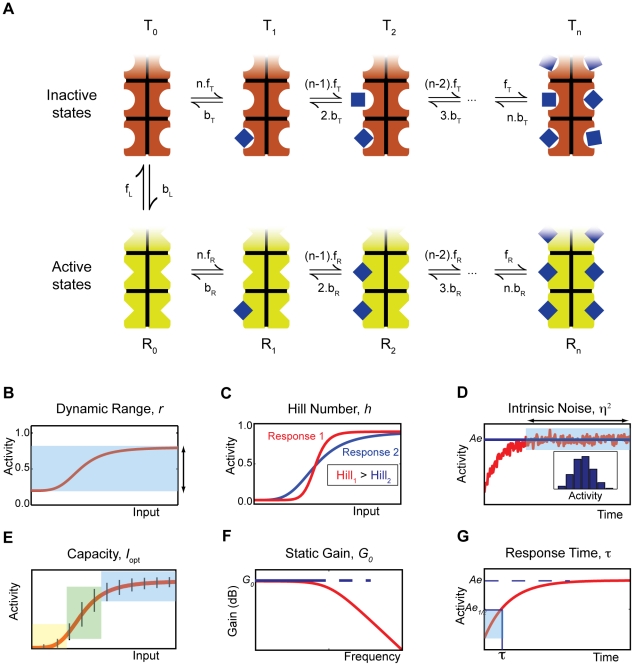
Figure 1. The MWC model of an allosteric sensor and illustrations of the different sensing characteristics of the system.
(A) The sensor exists in two conformational states, which have different affinities for the signal molecule being sensed. A sensor can transition from one conformation to another only when not bound by a signal molecule, but adding extra transitions does not alter our results. (B) The dynamic range, r, is the difference between the saturation and basal levels of activity. (C) The Hill number, h, is a measure of the steepness of the response curve and, indirectly, of the cooperativity of the activation of the sensors and the non-linearity of the response. (D) The intrinsic noise,  , quantifies the relative magnitude of the intrinsic fluctuations in the numbers of active sensors. Inset: histogram of the levels of activity at equilibrium. (E) The capacity, I
opt, provides an upper bound on the number of states that can be sensed and distinguished despite intrinsic noise (represented by the black vertical bars). In this example, the sensing system can distinguish between 3 states: low (yellow), medium (green) and high (blue). (F) The static gain, G
0, is the change in activity in response to a small step increment in the input signal. The frequency-dependent gain (red curve) decreases as frequency increases: the system is a low-pass filter. (G) The response time,
  , measures the time to reach the level of activity corresponding to half of its equilibrium level.

