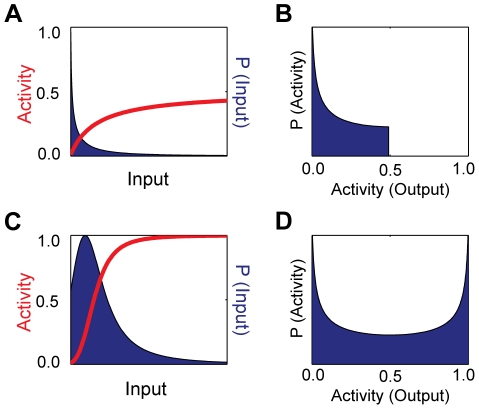
Figure 4. Maximising the information transferred through the sensing system determines optimal distributions for outputs and inputs.
(A) Optimal distribution of inputs (dark blue area) and activity (red curve) for a system where n = 1, K = 100, and c = 0.01. (B) Optimal distribution of outputs for the system in (A), which has a dynamic range of about 0.5. (C) Optimal distribution of inputs (dark blue area) and activity (red curve) for a system where n = 4, K = 100, and c = 0.01. (D) Optimal distribution of outputs for the system in (C), whose dynamic range is close to 1.

