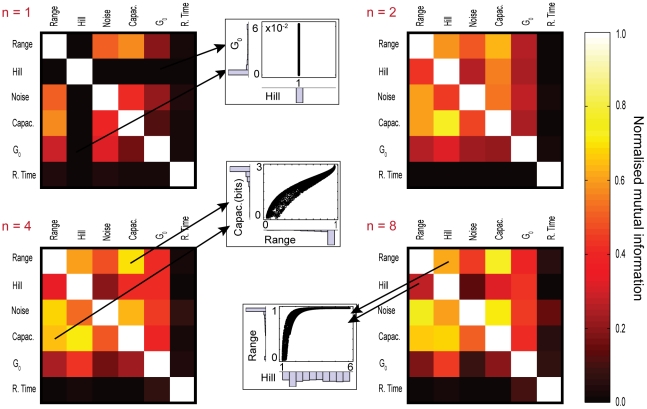
Figure 6. The mutual information between pairs of characteristics quantifies the dependency of one characteristic on another.
The four matrices show the mutual information between all pairs of characteristics for different numbers of allosteric binding sites per sensor n = 1, 2, 4 and 8. The mutual information is normalised by the entropy of the characteristics on the rows. The darker colours represent pairs that are relatively unconstrained and the brighter colours indicate pairs that are more constrained. The three scatter plots give three examples of different constraints. From top to bottom, we have scatterplots of the static gain versus the Hill number, of the capacity versus the dynamic range, and of the dynamic range versus the Hill number. When  , we observe a dark row corresponding to pairs involving the Hill coefficient because the Hill coefficient is always one when
  . The diagonals are white because the normalised mutual information of a characteristic with itself is always maximal.

