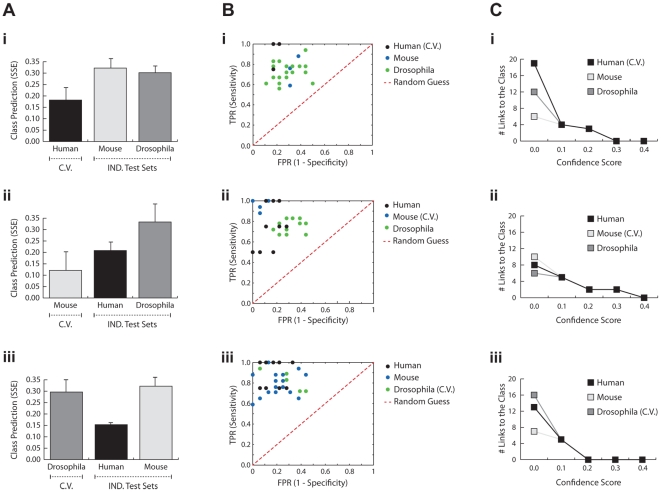
Figure 4. Performance of the exhaustive Dandelion algorithm.
A) The average Sum of Squared Error (SSE) for prediction of the disease phenotype (OPMD vs. control) given the gene expression profiles within the disease networks learnt on human (i), mouse (ii), or Drosophila (iii). The cross-validation set which is used during the training phase is depicted by C.V. and the independent test sets are grouped as IND. Test Sets. B) ROC space demonstrates the relative sensitivity and specificity of the generated networks in predicting the disease phenotype. The results from random expectations are illustrated by the red dash-line. C) Number of relationships between genes and the class node, after applying confidence thresholds, are depicted in line per species.

