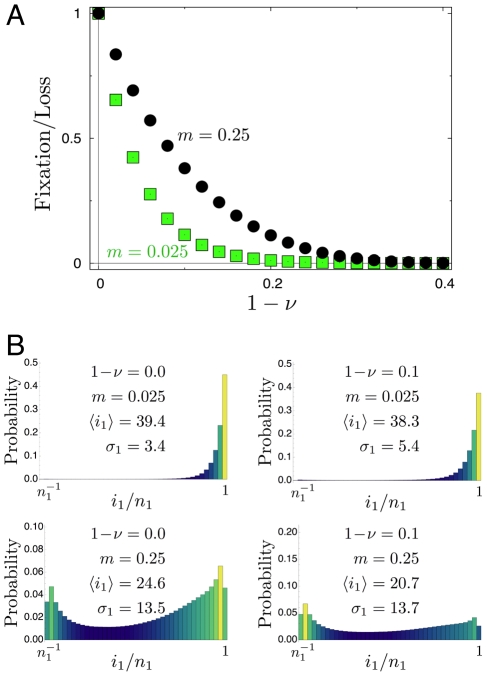
Figure 3. Fixation becomes unlikely with decreasing fitness of mutant homozygotes, variance in allele frequency increases with migration rate.
a) The ratio of fixation to loss of the mutant allele in a system of two populations of sizes  is shown as a function of the difference of homozygote fitness values
  , with initial condition
  ,
,  . Results are obtained from
  independent realizations with a heterozygote fitness of
  . As
. As  approaches
  , the probability of fixation in both patches goes to zero. b) For four different scenarios of homozygote fitness
  and migration rate
  we show the quasi-stationary distribution of the number of mutant alleles in population 1 (
 ,
,  independent realizations with initial conditions
  ). The average number of mutants in population
  is denoted by
  , the standard deviation by
  . As homozygotes become less fit, the distribution does not change significantly. However,
  increases with migration rate.

