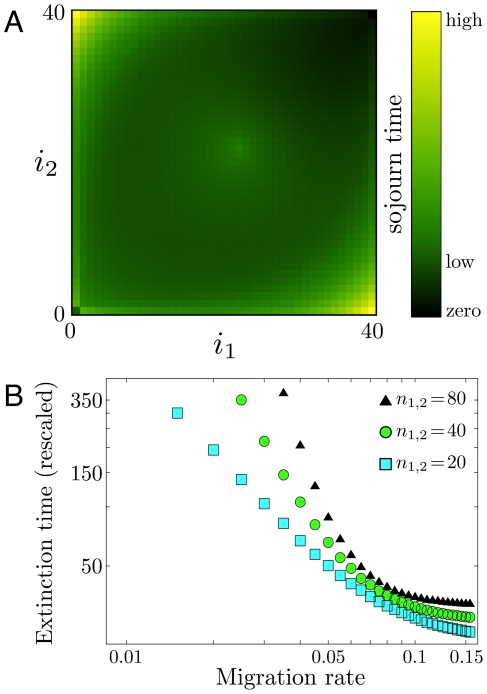
Figure 4. Mutant allele's extinction is delayed for small but non-vanishing migration rates.
(a) Histogram of the extinction process and the according extinction times as functions of the migration rate in systems of two equally large populations ( ,
,  ,
,  ,
,  ). This histogram can be obtained by averaging over sample trajectories such as those shown in Fig. 2. The initial condition is the unstable equilibrium near the center
  , the outcomes are conditioned on extinction (final state
  ). Histogram across the entire state space,
  ,
,  (
( realizations). For each state we give a record of the time spent. Black states are never visited, colored states are visited at least once. The brighter the color, the more often the respective state has been visited, which is characterized by a sojourn time in that state. (b) The mean extinction time rescaled by
  , for three different system sizes as a function of
  , in a double logarithmic plot. Symbols refer to
  (squares),
  (circles),
  (triangles) (
 realizations).

