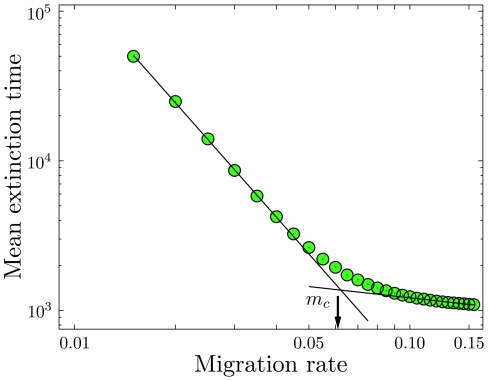
Figure 5. Transition from rapid to slow extinction as migration rate decreases.
The mean extinction time as a function of the migration rate ( realizations) for
  , in a double logarithmic plot for mutant homozygote fitness
  and heterozygote fitness
  . The initial condition is near the deterministic unstable equilibrium
  . The arrow indicates the value of critical migration rate of the deterministic replicator dynamics, Eq. 2,
  . Values for the probability of extinction for the same parameters are
  (
( ) and
) and  (
( ).
).

