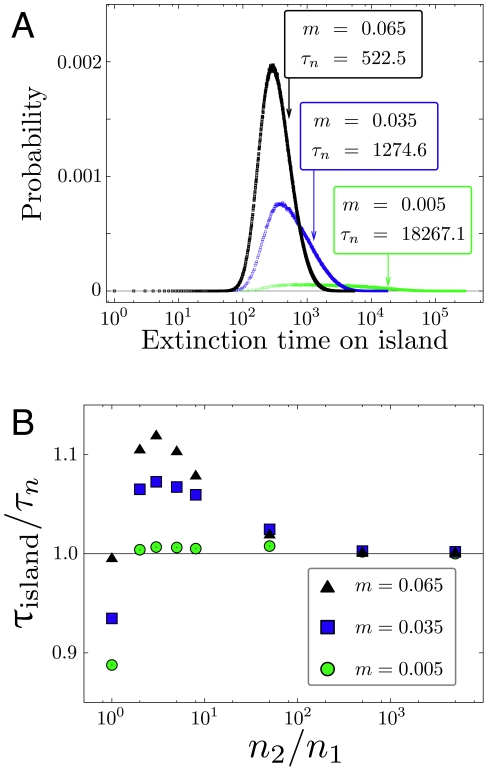
Figure 6. Maintenance of polymorphism in a small island population.
a) Histograms of the extinction time on an island population, Eqs. 12,13, for different migration rates in a log-linear plot. Population size is  , fitness of mutant homozygotes is
  , fitness of heterozygotes is
  . The histograms stem from
  independent realizations with initial condition
  . Each arrow indicates the mean extinction time
  , Eq. 22 (
 ). The values from simulation and the exact formula are in excellent agreement. With decreasing migration rate, the distribution of extinction times broadens significantly. b) For the same set of parameters we show how the (conditional) average extinction time of the mutant allele in a small population converges to the analytical result of the continent-island approximation with
  and variable
  (
( independent realizations).

