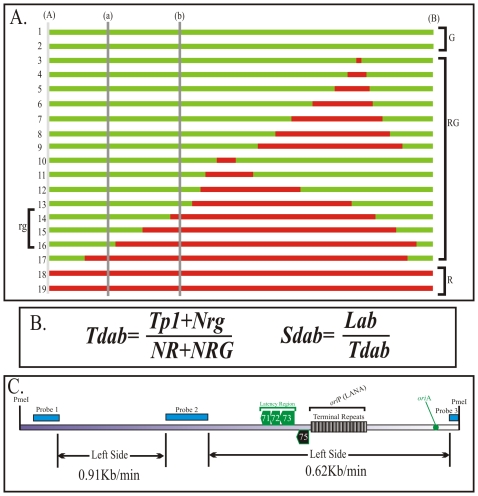
Figure 4. Calculation of the duplication speed of KSHV genome regions.
We used previously published procedure to calculate the duplication speed (Td) of different genomic regions. A. Schematic shows how to calculate duplication speed of any specific region with an example of Td calculation between regions (a)-(b) using information obtained from entire length replication profile. Nineteen hypothetical fully labeled molecules, with either single or both halogenated nucleotides, are shown in red and green colors. The molecules, which started and duplicated during first labeling period are depicted as fully red (R) and the one that completed their replication during second labeling period are shown in green (G). The molecules, which started their replication during first labeling period but completed during second labeling period are shown to have both red and green (RG). The numbers of red and green molecules, in the pool of total molecules, are proportional to the time required to replicate the region between (A)- (B). Similarly, the number of rg molecules depends on the time required to replicate the region (a)-(b). B. Equation to calculate the duplication time required for replicating the region (a)-(b). Tp1 is time used for first pulsing, which was 4 h for these experiments; NR, Number of Red (R) molecules; NRG, Number of RG molecules; Nrg; Number of rg molecules. The speed of fork movement, Sdab is calculated by dividing the distance (size) between the specified regions with the time (Tdab) required for the duplication of the specified region (a) and (b). C. Duplication speed of BCBL-1 KSHV genome, calculated based on the molecules shown in Figure 3 and supplemental Figure S4. The duplication speeds of region marked by double-headed arrows are indicated.

