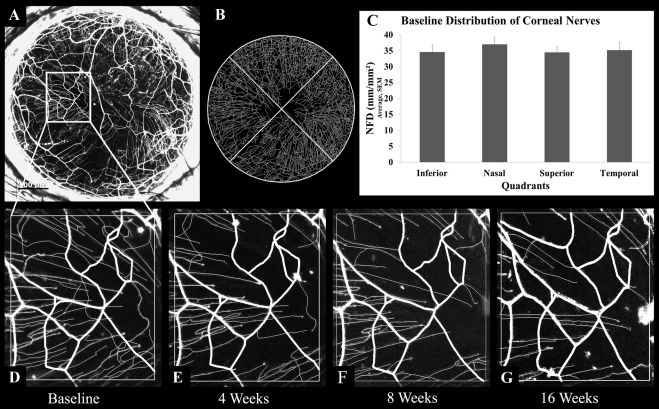
Figure 2.
Nerves in normal thy1-YFP murine corneas. (A) Maximum intensity projection image of fluorescent nerves in a normal cornea. (B) Image generated after performing nerve tracing with neuron reconstruction software on the cornea shown in A. (C) Mean nerve fiber density in the inferior, nasal, superior, and temporal quadrants of normal corneas (n = 3). (D–G) An area of the cornea (A) was monitored for 0 (D, baseline), 4 (E), 8 (F), and 16 (G) weeks. Note that the subbasal hairpin nerve pattern, but not the stromal trunk pattern, changed over these serial observations. Scale bar, 500 μm.

