Figure 4.
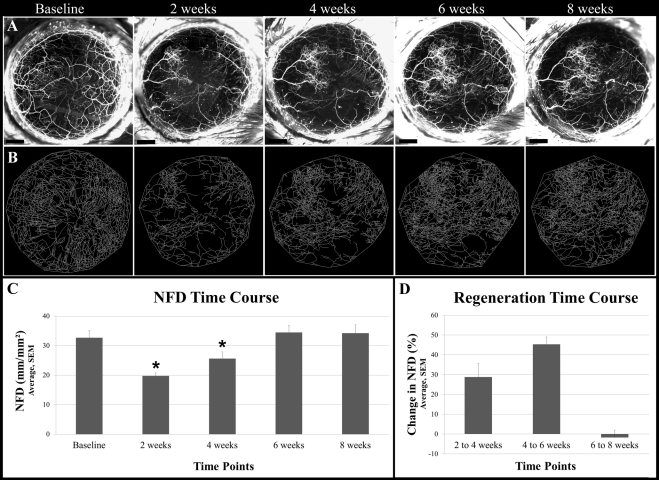
In vivo serial imaging of regenerating nerves after lamellar corneal surgery. (A) Maximum intensity projections images of the cornea showing fluorescent nerves preoperatively (baseline) and postoperatively at weeks 2, 4, 6, and 8. (B) Images generated after performing nerve tracing with neuron reconstruction software on the cornea shown in A at corresponding time points. (C) Mean NFD at baseline and at weeks 2, 4, 6, and 8. NFD at 2 and 4 weeks is significantly reduced compared with baseline (P < 0.05) (D) Percentage changes in NFD over weeks 2 to 4, 4 to 6, and 6 to 8. Scale bars, 500 μm.

